


Closely related to instrumental analysis, the chemometric analysis process of ChemPatternTM fully satisfies the requirement for quantitative analysis. The analysis process system integrated a series of data analysis processes, including independent variables selection, data pretreatment, data dimension reduction as well as cross-validation etc. With parameter optimization design, the various core algorithms become easy to be operated, and thus detailed results with interactive charts can be obtained by only a few mouse clicks. Specific functional components are as listed below.
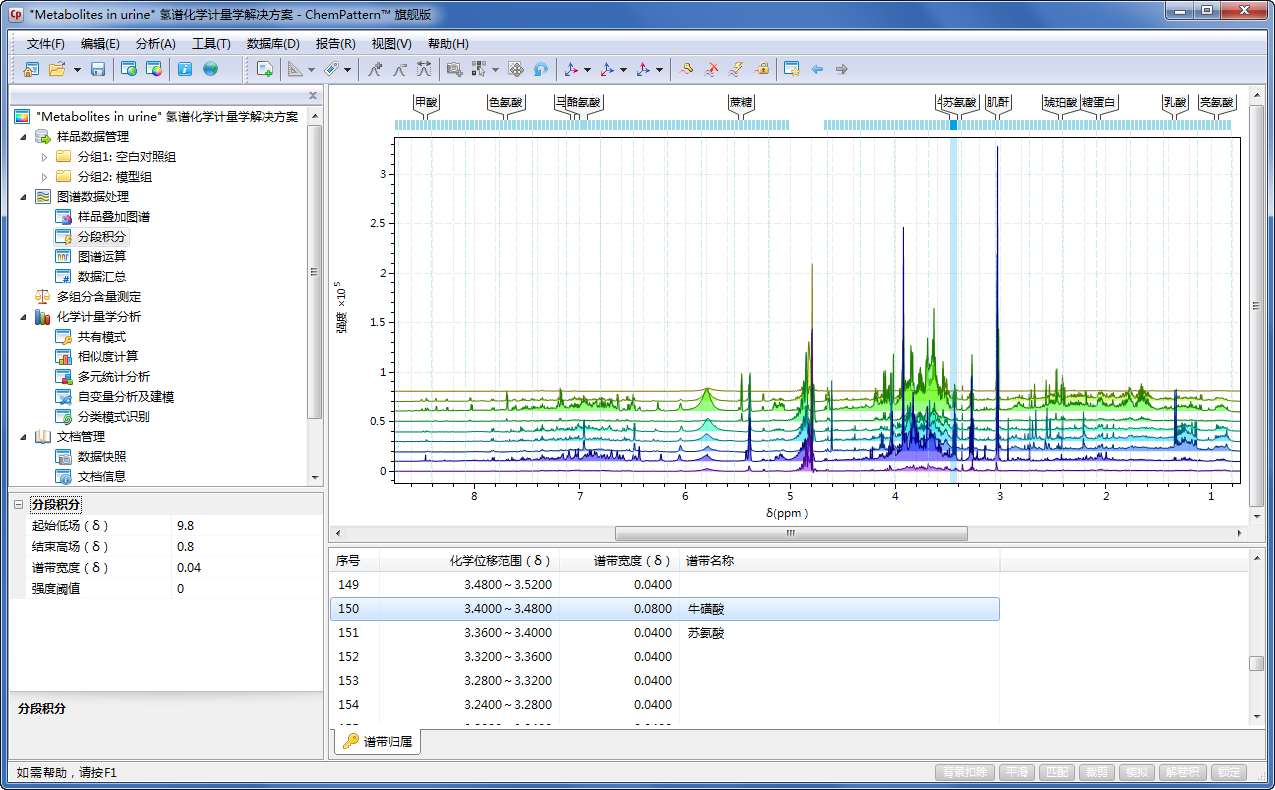
Data pretreatment
Raw samples can generate the suitable data required by chemometric analysis only through a serious of mandatory processes including signal extraction, calibration and data standardization etc. In ChemPatternTM, these operations can easily be customized and executed independently in ten steps.
Multivariate analysis
Unlike classic statistical methods with specific handful variables as subject, multivariate statistical analysis, also known as multivariable data analysis, simultaneously and comprehensively analyzes all independent variables as well as the multiple associated dependent variables of samples, thereby obtaining links between variables and data structure information.
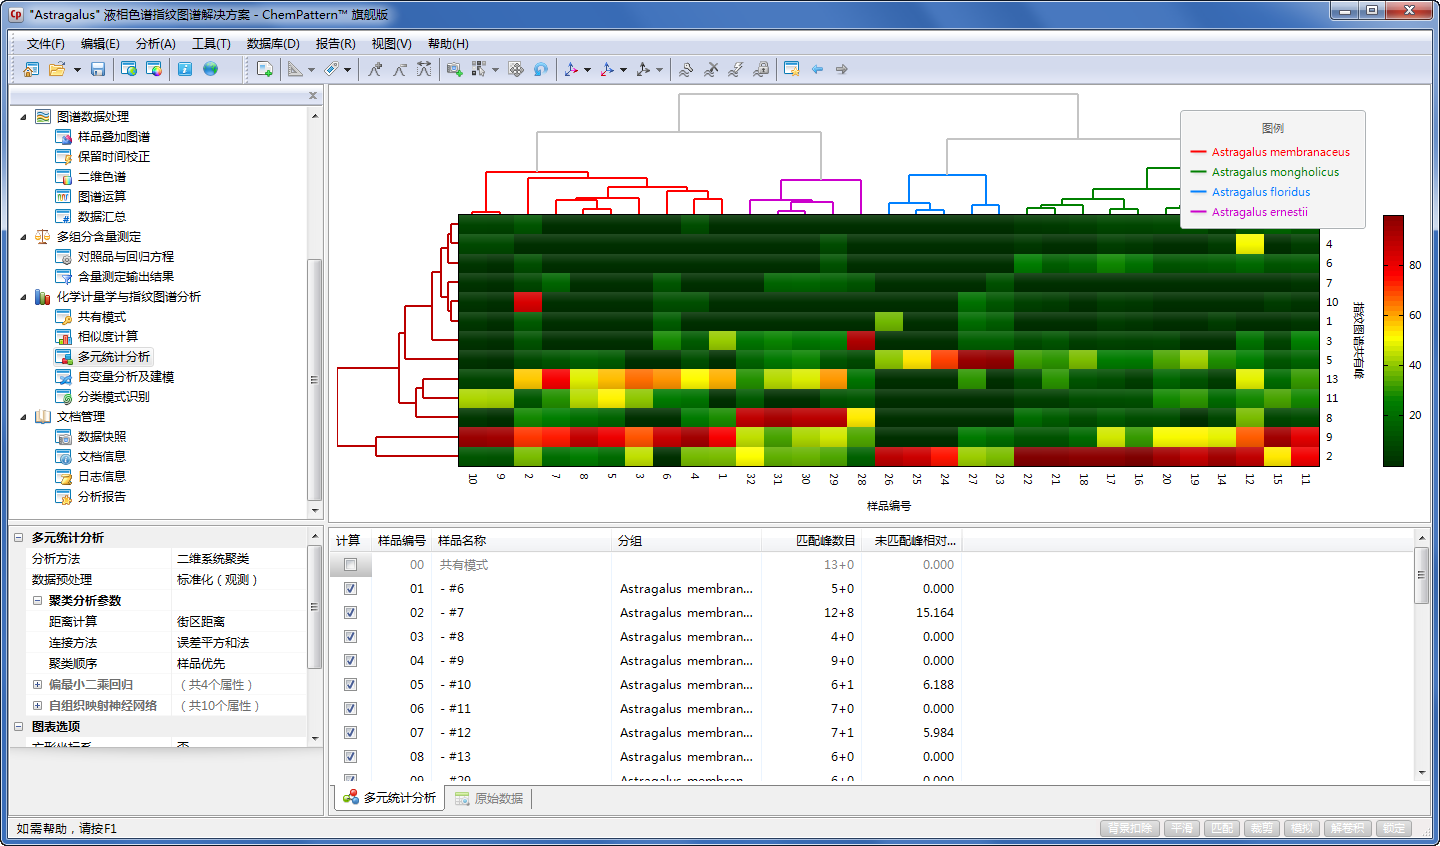
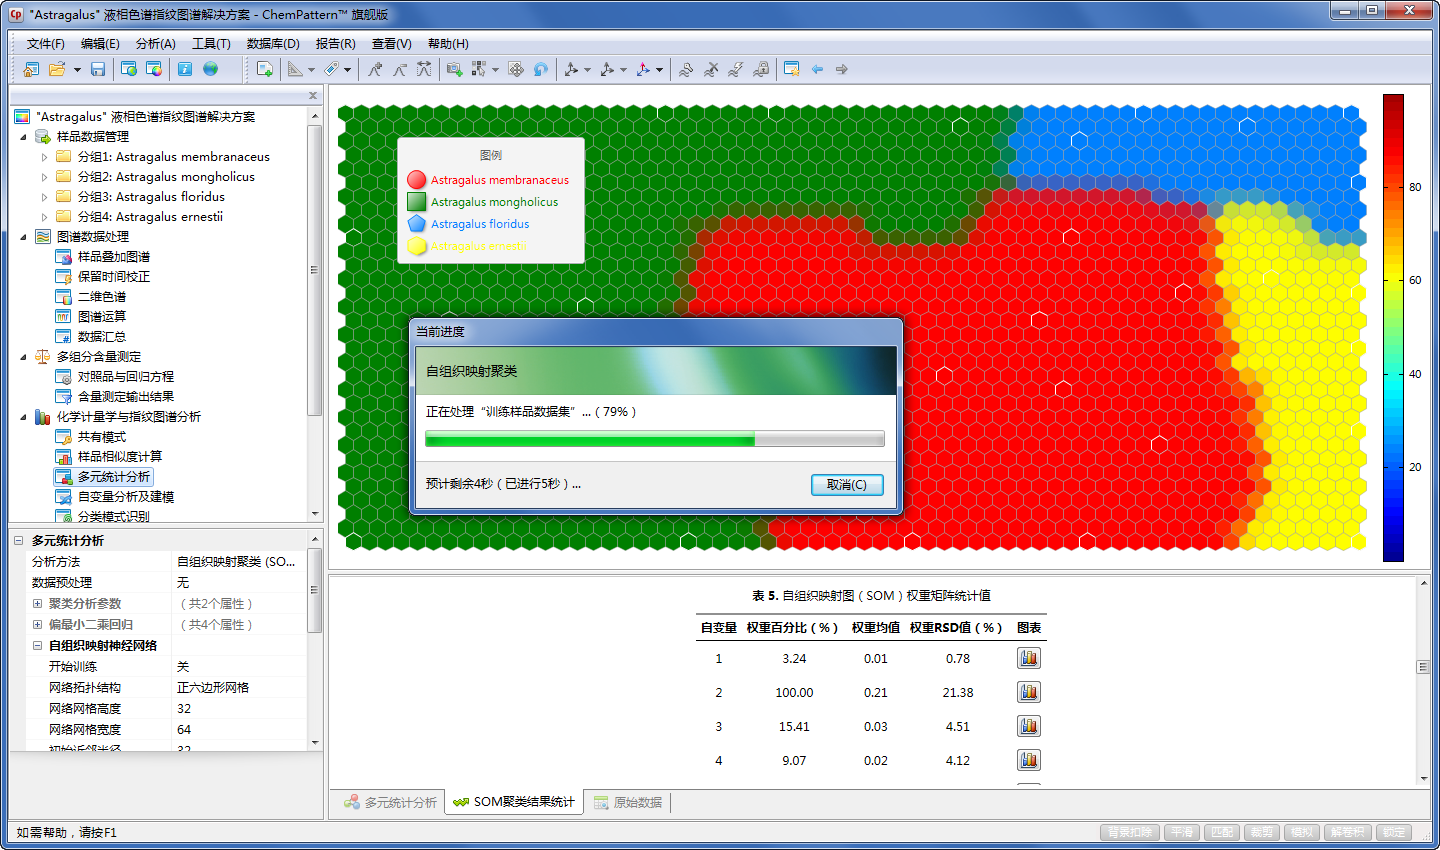
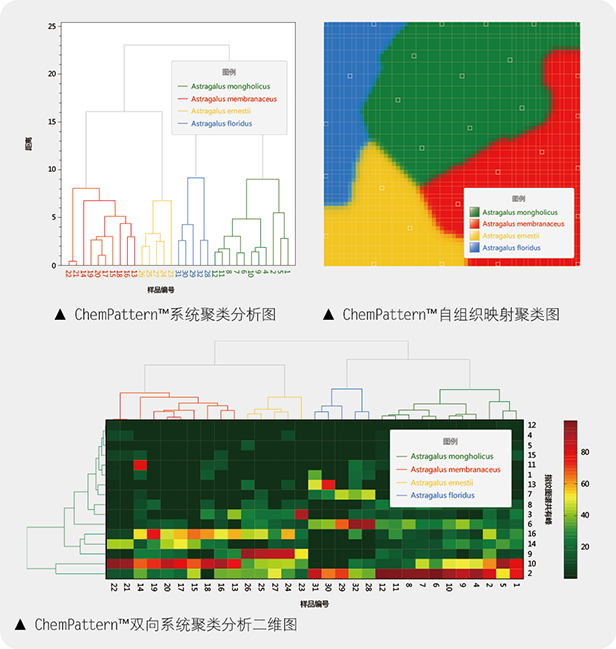
Cluster analysis
Cluster analysis in multivariate statistics is widely applied in analytical chemistry and chemometircs. ChemPatternTM provides many cluster analysis methods, such as hierarchal cluster analysis and two-way hierarchal cluster analysis, as well as non-linear self-organizing map analysis which is based on artificial neural network.
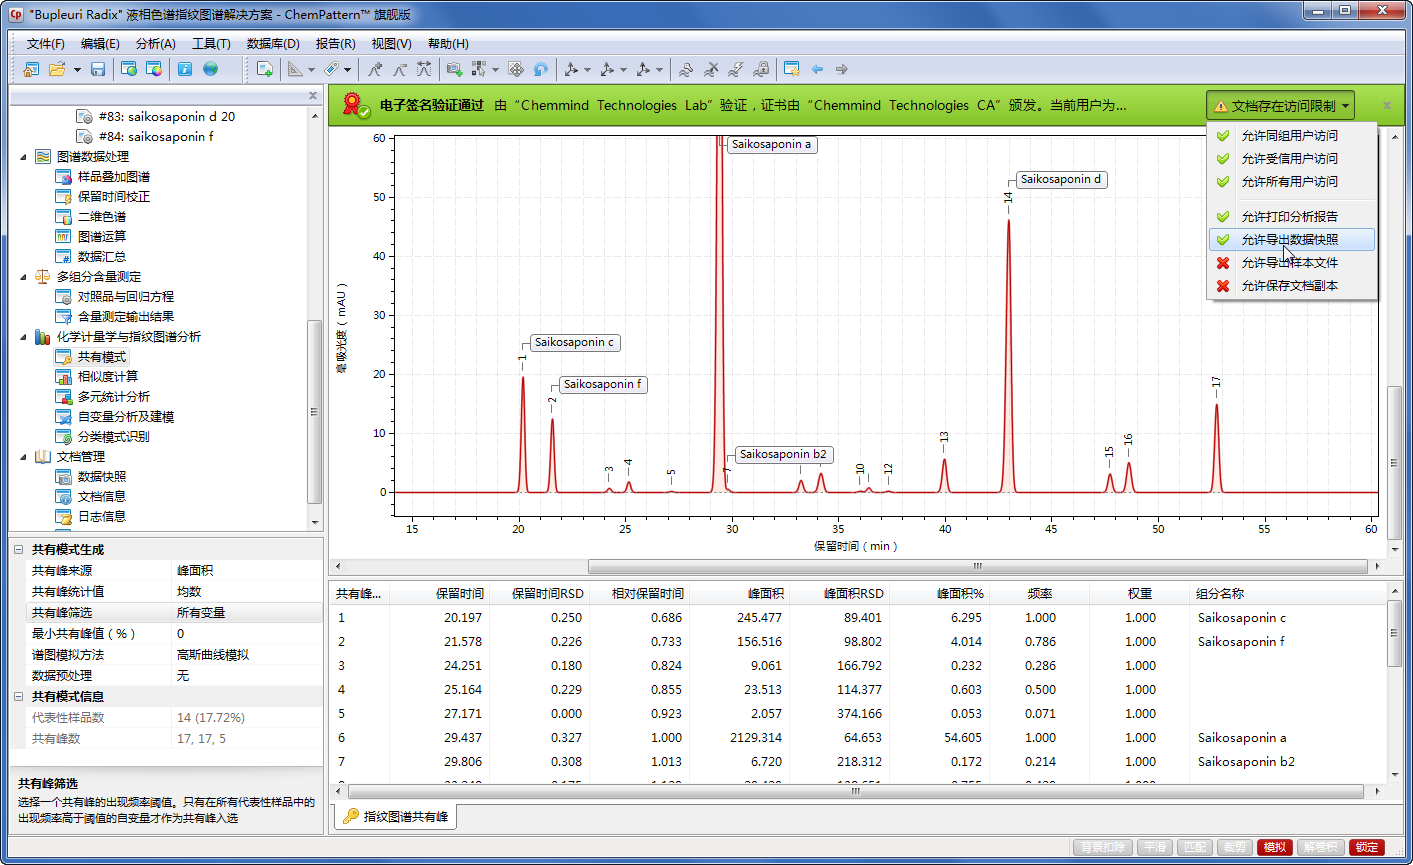
Similarity analysis
Similarity analysis is a general term for algorithms evaluating the similarity between the vectors or matrixes that compose samples. It is widely applied in informatics and related fields. ChempatternTM offers support for various types of algorithms that present similarity evaluation of chemical fingerprints.
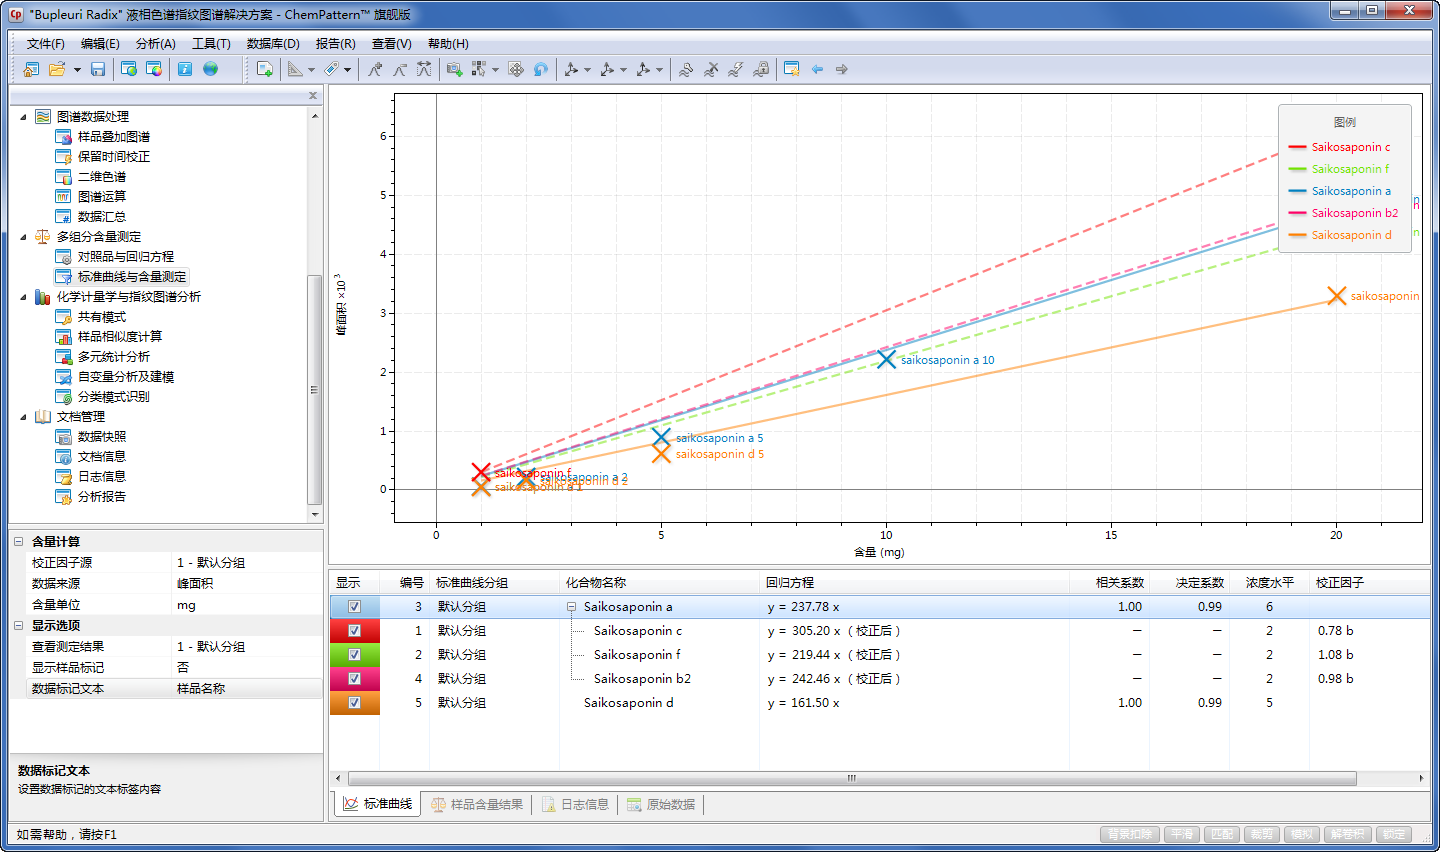
Regression modeling
Regression analysis is a general term for the construction methods of regression equations, i.e. regression forecasting models, based on correlation calculation between independent and dependent variables. Being widely applied in chemometrics, regression analysis including calibration curve method and multivariate quantitative calibration model is a key for quantitative determination in instrumental analysis. ChemPatternTM provides widely-used multiple linear regression method and partial least squares regression method.
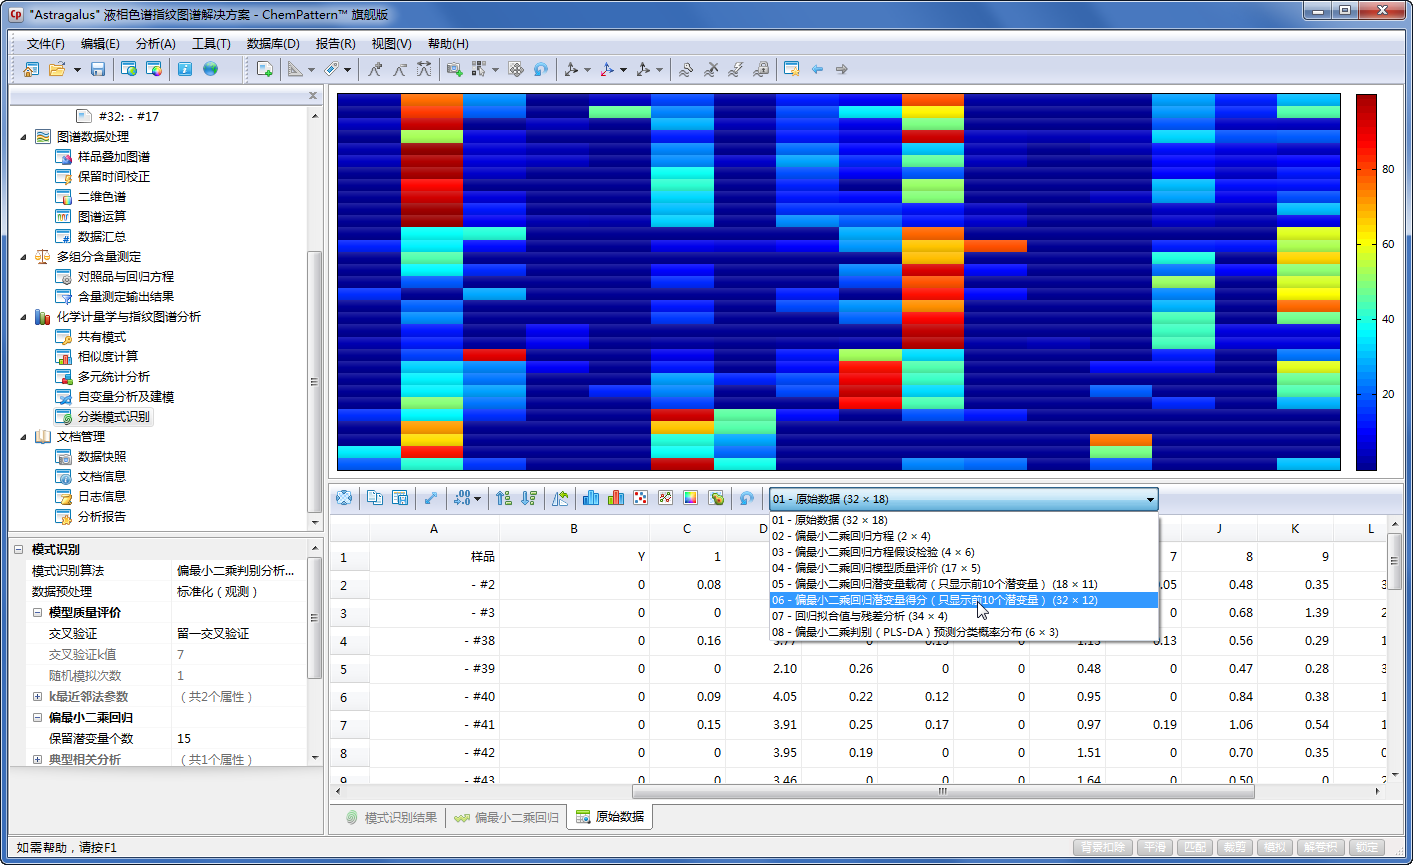
Chemical pattern recognition
The advanced chemical pattern recognition module of ChemPatternTM can perform the functions of classification, estimation and forecast for the complex system samples in analytical chemistry. Detailed functions include supervised and unsupervised learning algorithms, training set and test set designing, modeling parameter optimization and model quality evaluation. Moreover, the six distinctive algorithms represent the latest progress of this technology in chemometrics.
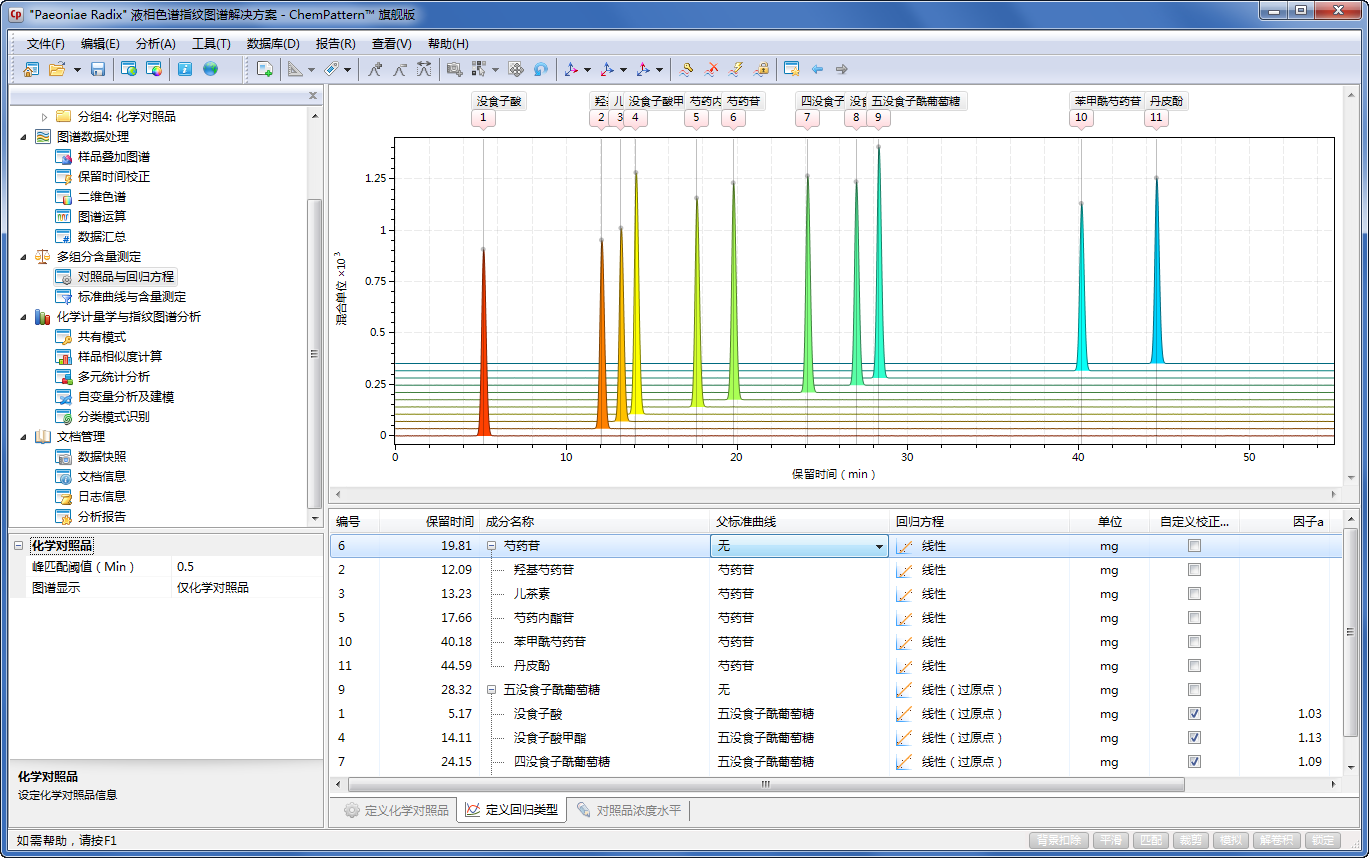
Quantitative analysis of fingerprint-efficacy relationship
By providing quantitative analysis including comprehensive multicomponent content determination, ChemPattern™ensures efficiency for chemometrics, especially quantitative analysis of fingerprint-efficacy, and further achieves co-platform quantitative analysis of different types of analytical chemistry data.
Support vector machine and artificial neural network
ChemPattern™ offers a comprehensive support in chemometrics to the cutting-edge technologies in machine learning, including support vector machines, and artificial intelligence technologies represented by artificial neural network. These methods have demonstrated good applicability and excellent performance in analysis of complex systems.
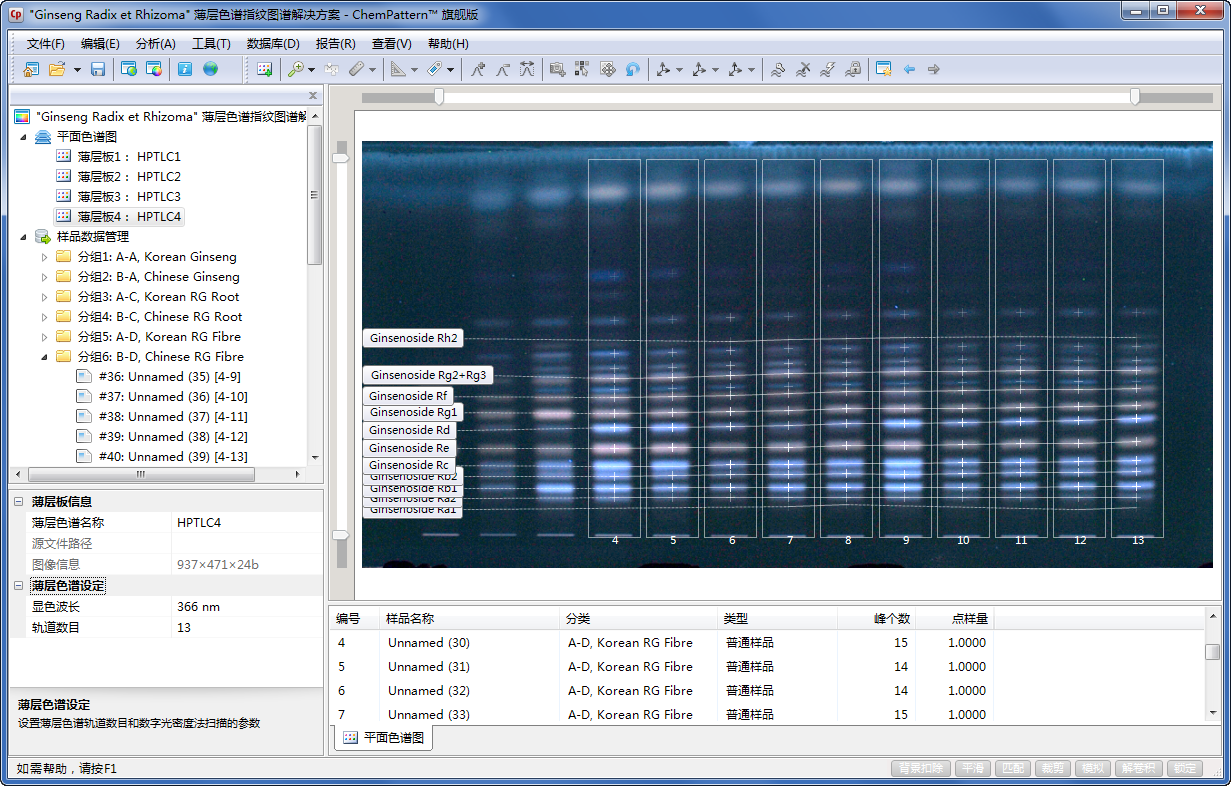
High-content analysis and data mining
The chemometric analysis of ChemPatternTM fully utilizes all valid information carried by high-dimensional data from analytical instruments; these data include the characteristics of the properties, composition and classification of compounds. Combining quantitative markers of samples, it also measures and conducts exhaustive data mining upon the samples from multiple perspectives of independent variable analysis, regression prediction, discrimination and classification, and eventually obtains various information that cannot be acquired by traditional data analysis methods, including intrinsic quality, composition and evolution trends of complex systems.